
So I am working on a DIY antenna analyzer/impedance meter. But I need to validate my design against a known antenna analyzer. I do not own one.
But I do — my Elecraft KX3 can calculate SWR. If you know the menus, you can bypass the tuner, press/hold the TUNE button, and read the SWR. The Android app KX3 Companion does this to plot a simple 5 point SWR calculation (the author, Andrea Salvatore IU4APC, writes a lot of great Android amateur radio apps – see her KX3 companion page).
The KX3 has a mode where just about any button you can press or menu option you can change can be controlled via over its serial/USB interface. So why not write an app? So I did. It took a lot of trial and error — reading the SWR from the display was tricky, as was the ordering of some of the command and picking an appropriate settling time.
Use of this Python script requires that the PySerial, ArgParse, and MatPlotLib Python modules are installed. Assuming you change the path to the serial device, I expect it will work on any platform (I developed it on OSX). The final version is run from the command line but fully featured, and incorporates built-in band lists for the non-WARC bands plus 30m, and outputs a text list as well as graphical plots, with the ability to suppress either.
This program was updated by John Ogrem (WX0M, r2bqdnx@gmail.com), in November 2021. His edits reflect the addition of an “SW” command making it easier to read SWR from the KX3. The revised version is available here -> kx3swr.py. My original version is available at -> kx3swr-v1.py.
Disclaimer: this is freely distributed software, untested on your hardware, that will control your radio’s transmitter. Use at your own risk!
Here is the command line help.
usage: kx3swr.py [-h] [-noplot] [-notext] [-waittime WAITTIME] b [b ...]positional arguments: b band [band band ...] (choose 10 20 30 40 80 160)optional arguments: -h, --help show this help message and exit -noplot do not generate plots -notext do not generate output text -waittime WAITTIME change default settling time in seconds after each measurement (default is 2.5 sec)
Here is the text output of a 20m sweep of my B&W AP-10 (whip with load coil and counterpoise) and the resulting plot.
$ ./kx3swr.py 20 running sweep for 20mband 20m 14.0 1.7 14.025 1.5 14.05 1.4 14.075 1.3 14.1 1.2 14.125 1.2 14.15 1.1 14.175 1.1 14.2 1.2 14.25 1.3 14.3 1.6 14.35 2.020m SWR plot creation
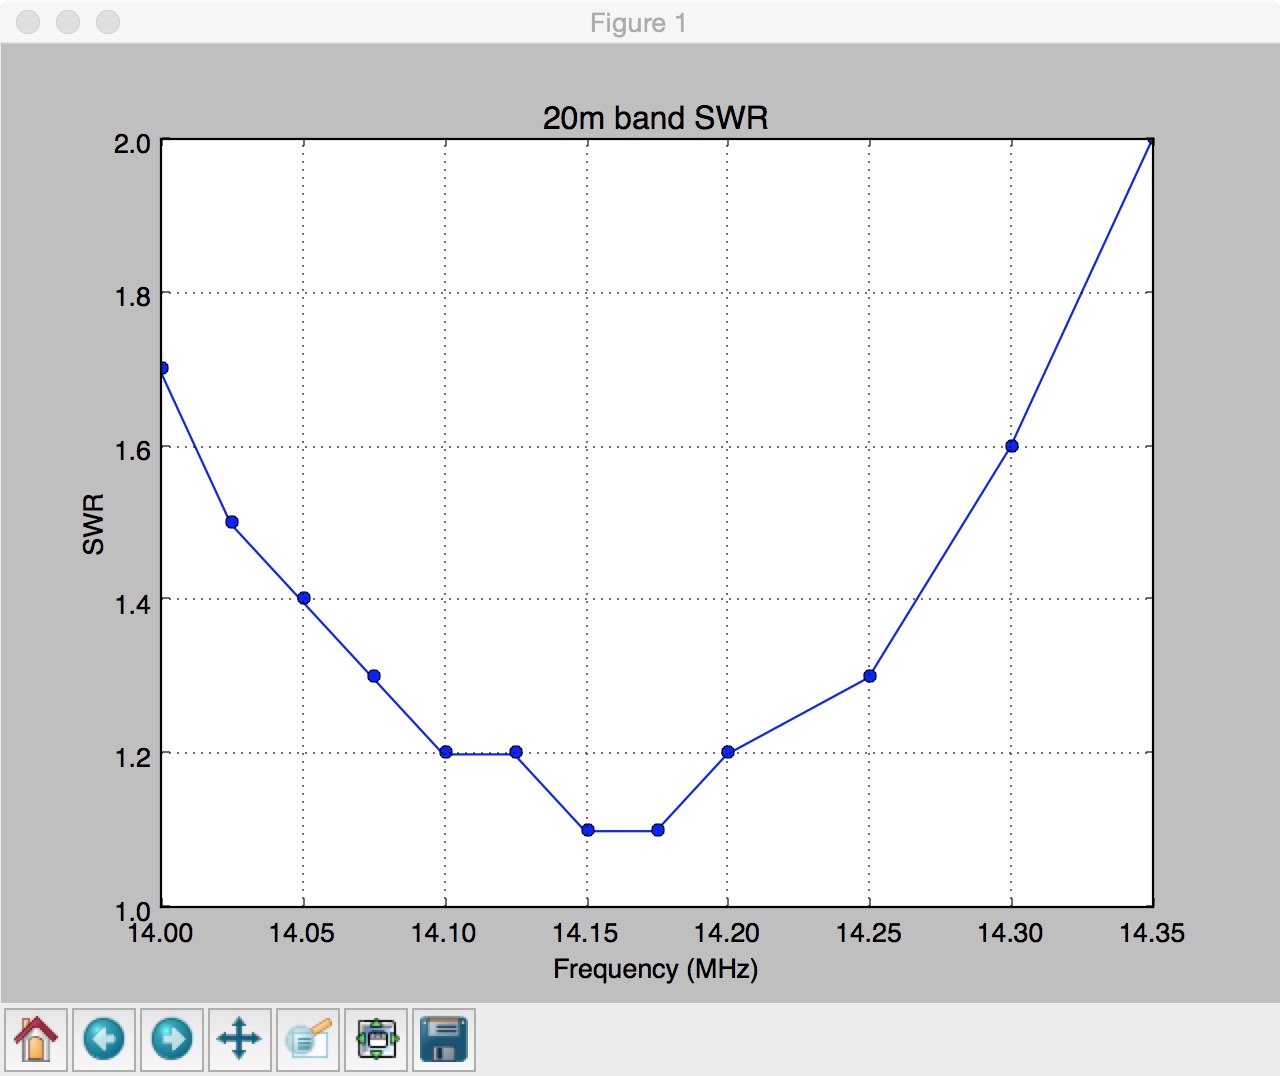
The SWR can only be read to one decimal place, since it is extracted from the display of the KX3 itself.
Future plans include another command line option to sweep a start and end frequency with a specified increment. I have never used ArgParse before, but it makes command line parsing and documenting really easy. Now that I know how the serial stuff works, I’d like to put this on a microcontroller system to take into the field with me.
I have learned a few things by having this. For example, I operate QRP from a condo with a whip and load coil on my balcony. I usually set the coil lead by listening to the volume, and there are usually two adjacent windings that sound about the same. From this analysis and running some sweeps, I learned that one winding of the coil changes the resonant frequency by almost 400 kHz, and that moving the lead a 1/4 turn can shift the resonant frequency by 100 kHz. So picking the right tap by ear alone might only get me within +/- 400 kHz of my desired resonant frequency. I also learned the importance of counterpoise length and positioning. The above is the best case after some playing with the counterpoise and lead tap location. The KX3 has a great tuner, but a more efficient antenna is a more efficient antenna, especially for transmitting QRP!
Theory of operation: For those who are curious, the general logic of the program is as follows:
- saves your frequency and operating mode
- puts the antenna tuner into bypass
- for each band
- switches to that band and the initial frequency in the list for that band
- sweeps a range of frequencies, and for each frequency
- measures SWR by the TEST button, turns off transmitter 2.5sec later
- extracts SWR from the display reading
- restore original frequency and operating mode
- return tuner to auto-tune
- print output
- plot output
This program required a lot more effort than the finished code might suggest. There was a lot of trial and error using the KX3 Utility in command mode and sending commands, figuring out how the KX3 responded. Sometimes order and timing matter. Something theoretically straightforward like reading the SWR from the display turned out to be surprisingly odd. The KX3 Programmer’s Reference was a critical reference for all of this, and many thanks to Elecraft for publishing such a document.
Hi! You can also check out Wizkers:Radio (http://wizkers.io/wizkersradio ) which includes a SWR analyzer as well, is open source, and available on Mac, PC, Linux, Chromebook and Android!